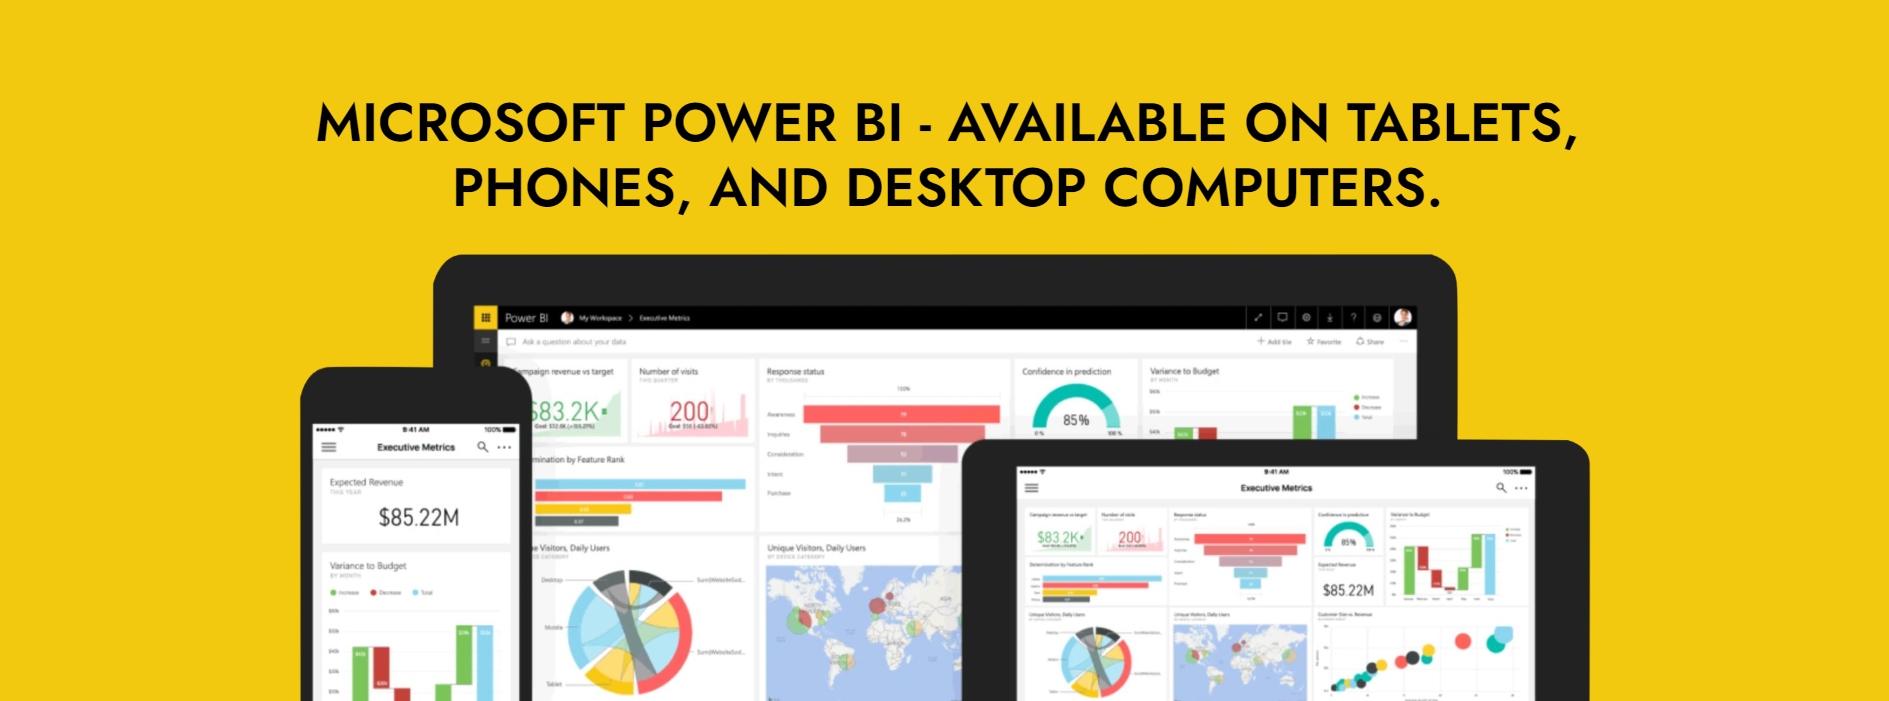
Microsoft Power BI is a Business Intelligence (BI) Tool which is used to find insights within an organization’s data.
Power BI can help connect separate data sets (data from 100+ different sources), transform & clen the data into a data model and create charts or graphs to provide visuals of the data.
All of this can be shared with other Power BI users within the organization.
The data models created from Power BI can be used in several ways for organizations, including the following:
Telling stories through charts & data visualizations.
Examining “what if” scenarios within the data.
Creating reports that can answer questions in real time and help with forecasting to make sure departments meet targets.
Power BI can also provide executive dashboards for administrators or managers, giving management more insight into how departments are performing.
Can Power BI by utilized all Businesses?
Yes.
Essentially all Businesses have huge amounts of data, and this data should be analyzed regularly using BI Tool’s to come up with insights. Companies that do not utilize the tools at their disposal to gain insights from their data, will be left behind. So, why not use the most popular and easy to use Business Intelligence tool, Power BI?
Examples of Reports/Dashboards Power BI can be used to create:
Digital Marketing Reports.
Website Analytic Reports.
Sales & Analysis Reports.
Customer Profitability Reports.
Financial Analytics Report
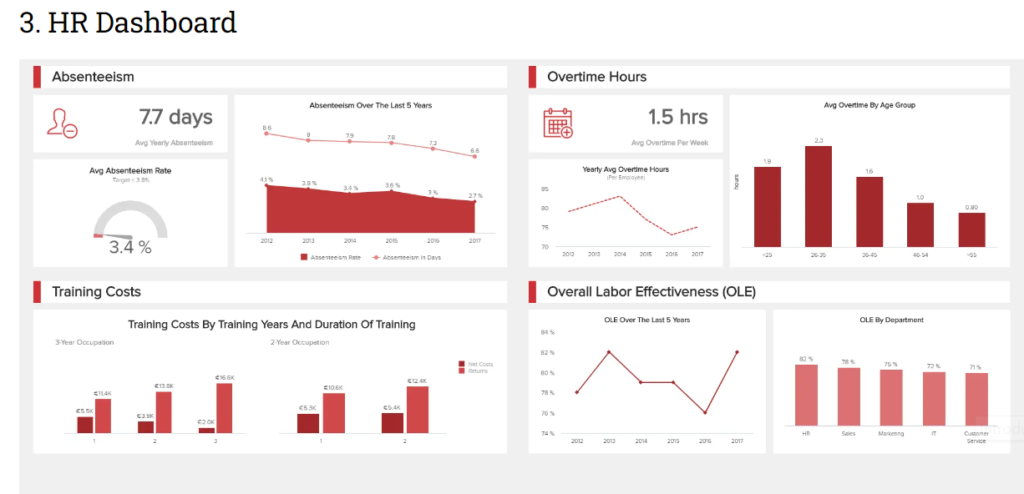
HR Analytics Report.
Predictive Analytics Reports.
Augmented Analytics Reports (AI)
And more.
Not only can Power BI be used to create any type of report, the reports can be automatically linked into a PowerPoint Presentation while also keeping the Interaction Features.